
Introduction
Healthy lakes enhance our quality of life. They sustain food webs and provide habitat for fish and wildlife. Lakes contribute to a healthy economy, supporting tourism and recreation and supplying drinking water. For the National Lakes Assessment, the Environmental Protection Agency, states, Tribes and other partners surveyed a wide array of lakes, from small ponds and prairie potholes to large lakes and human-made reservoirs (see Acknowledgments for a list of partners).
The National Lakes Assessment: The Fourth Collaborative Survey of Lakes in the United States presents the results of the 2022 survey of lake condition in the conterminous United States. Earlier surveys took place in 2007, 2012 and 2017. The 2007 study addressed larger lakes only (those greater than 4 hectares) and a subset of the current survey indicators. During spring and summer of 2022, 80 field crews sampled 981 lakes, using standardized sampling procedures to collect data on biological, chemical, physical and recreational indicators. The measured values were compared to NLA benchmarks to assess lake condition.
The NLA is designed to answer the following questions about lakes across the United States. The answers to these questions can help stakeholders plan for the protection and restoration of these lakes.
- What percent of waters support healthy ecosystems and recreation?
- What are the most common water quality problems?
- Is water quality improving or getting worse?
- Are investments in improving water quality focused appropriately?
The NLA is one of four statistical surveys that make up the National Aquatic Resource Surveys program, which is designed to assess the condition of all waters nationally over time. For more information, see the NARS history page.
In addition to examining the health of lakes on a national scale, the NLA is designed to provide statistically valid results on the condition of different subpopulations. Subpopulation results can provide additional information on a regional scale or for a particular lake type (natural lakes vs. reservoirs).
This report focuses on NLA 2022 results at national scale, comparing the condition of lakes to that from earlier NLA studies. The NLA can help us better understand the condition of lakes in the United States, some of the stressors affecting them, and how stressors relate to local conditions. While this report explores associations between stressors and biological indicators of condition, additional research is needed to explain the causes of degraded conditions or to identify sources of stressors. Further, data from future assessments will help determine whether changes observed between 2012 and 2022 represent a trend or reflect natural variability.
KEY FINDINGS ON 2022 CONDITION
Following standard practices (described in the Background section), EPA analysts classified results for most indicators as good, fair or poor. For a few indicators, results indicate whether contaminants were detected or whether levels exceeded a single benchmark.
End of side note.Nutrient pollution was the most widespread stressor measured.
- Across the country, 50% of lakes were in poor condition with elevated phosphorus, and 47% were in poor condition with elevated nitrogen.
- Excess nutrients can contribute to algal blooms and low oxygen levels, affecting ecological health, public health and recreation in lakes.
High levels of algae and cyanobacteria growth were observed.
- Hypereutrophic conditions, typically characterized by excess nutrients high levels of algae growth and low transparency, were observed in 30% of lakes.
- Chlorophyll a, which indicates the amount of algae and cyanobacteria present, was in excess and rated poor in 49% of lakes.
Poor biological condition was more likely when lakes were in poor condition with respect to nutrients.
- Nationally, in lakes where phosphorus was elevated, benthic macroinvertebrate communities (e.g., insect larvae, snails and clams living on the lake bottom) were 1.7 times more likely to be in poor condition. In natural lakes (i.e., excluding reservoirs), this risk increased to 2.2.
- Based on benthic macroinvertebrates, the EPA found that 29% of lakes were in poor condition and 26% of lakes were in fair condition.
- Based on zooplankton (microscopic animals in the water column), 25% of lakes were in poor condition and 25% of lakes were in fair condition.
A field crew member entering data into a tablet, Summit Lake, Washington. Washington State Department of Ecology.
Lakeshore disturbance was widespread, yet other physical habitat conditions were rated good in more than half of all lakes.
- Only 16% of lakes were in good condition based on lakeshore disturbance measures, indicating moderate to high levels of human activity and shoreline alterations in 84% of lakes.
- Drawdown was poor in 5% of lakes, representing 13,400 lakes. The drawdown indicator measures water levels and their fluctuation; large drawdown indicates poor habitat condition.
- Most lakes were rated good for shallow water habitat (55%), riparian (lakeshore) vegetation cover (52%), and habitat complexity (51%) conditions.
- Poor biological condition was twice as likely when riparian vegetation cover or lake habitat complexity were in poor condition.
Microcystins, a type of cyanobacterial toxin, were detected in 50% of lakes.
- Microcystins measured in the open waters exceeded the EPA recreational criterion in 2% of lakes, representing 5,360 lakes across the nation.
- Cylindrospermopsin, another cyanobacterial toxin, was detected in 12% of lakes but did not exceed the EPA recreational criterion in any lakes during the 2022 survey.
- For information on cyanotoxins in specific lakes, people should check with state, Tribal or local governments before swimming, boating or fishing.
The herbicide atrazine was detected at low levels in 41% of lakes.
- Atrazine levels exceeded the EPA benchmark, the "concentration equivalent level of concern" for aquatic plant communities, in 0.9% of lakes, representing 2,430 lakes.
Contaminants were present in all fish tissue, but risk varied by contaminant and by fish consumption level.
- Every fillet tissue sample contained detectable levels of mercury and polychlorinated biphenyls (PCBs), which corresponds to an estimated 58,747 lakes containing fish with detectable levels of these contaminants.
- In the lakes assessed for per- and polyfluoroalkyl substances (PFAS), an estimated 95% contained fish with detectable levels of perfluorooctane sulfonic acid (PFOS). In addition, seven other PFAS were detected in fish collected from at least 15% of lakes. Sixteen of 40 tested PFAS were not detected in any of the tissue samples.
- The percentage of lakes that contained fish exceeding mercury and PCB screening levels in fillet tissue is as follows:
- Mercury: 51% exceeded the EPA’s tissue-based water quality criterion for mercury.
- Total PCBs: 23% exceeded the cancer screening level for high-frequency fish consumers, who eat four or five 8-ounce meals per week, and 6% exceeded the cancer screening level for general fish consumers, who eat just one 8-ounce meal per week.
- People who eat locally caught freshwater fish should consult state and Tribal agencies responsible for issuing fish advisories.
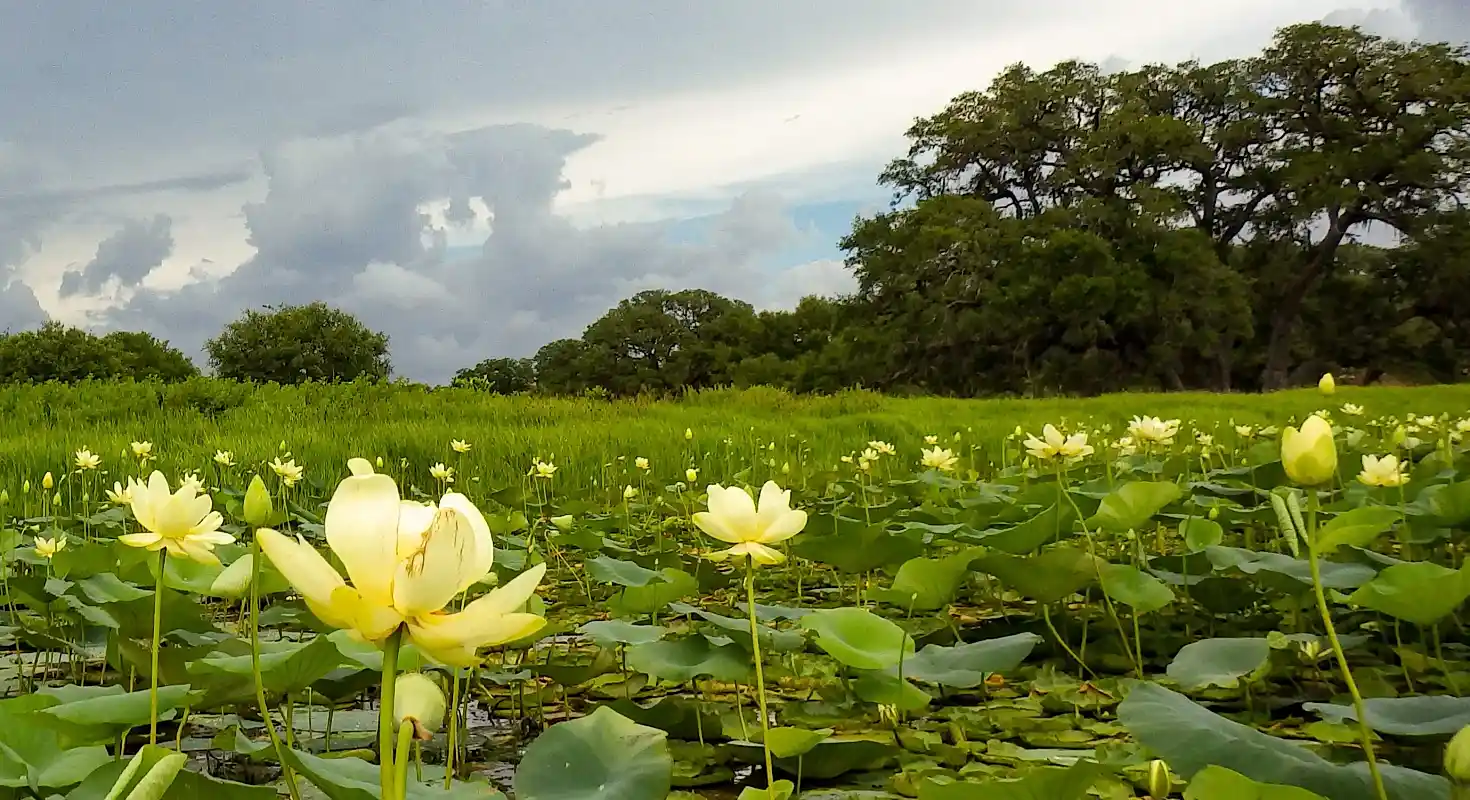
American lotus, a plant that grows in shallow water, in a Texas lake. University of Houston Clear Lake.
KEY FINDINGS ON CHANGE FROM 2017 TO 2022
For both nutrients and biological indicators, there was little change between surveys at the national level.
For both microcystins and atrazine, the small percentage of lakes with concentrations that exceeded the human health (2%) and aquatic life (0.9%) risk benchmarks, respectively, did not change significantly.
There were significant changes in some chemical and physical habitat measures in 2022.
- The number of lakes with good shallow water habitat decreased by 9 percentage points, to 55%.
- The number of lakes with good ratings for lakeshore disturbance decreased by 9 percentage points, to 16%.
- Detection of microcystins increased by almost 30 percentage points, to 50%.
- Detections of atrazine increased by 11 percentage points, to 41%.
NLA DASHBOARD
The EPA developed an interactive dashboard to accompany this report. It contains regional results, allows comparisons between natural lakes and reservoirs, and compares 2022 results to prior surveys. For example, in addition to the significant change described in this report for the period 2017 to 2022, the dashboard shows several other indicators that experienced significant change in condition from 2012 to 2022. The dashboard also allows users to explore results for the subset of lakes greater than 4 hectares, beginning with NLA 2007.
Users can also access the dashboard by following the link at the bottom of each graph in this report, which brings them to a customized page with regional data for each indicator. Users can then navigate to other dashboard views using the "Condition Estimate" dropdown and other dashboard controls.
HOW CAN I FIND OUT MORE?
Read the other sections of this report for more detail on the results nationally for each indicator, including results from 2012. See the NLA 2022 Technical Support Document (U.S. EPA 2024) for technical details on the survey design, benchmarks and data analyses that underpin the findings in this report. Additional information on the NLA and previous reports is available at the EPA NLA home page. Readers may want to visit the main NARS website periodically to view additional products using the science and data from the assessments, such as published scientific research and results for other surveys in the NARS program.
Background

EPA staff demonstrating collection of a zooplankton sample. To learn more about zooplankton sample collection, view the NLA zooplankton collection training video. Great Lakes Environmental Center.
This section provides a brief background on the survey methodology. For details on survey design, field methods and quality assurance plans, see the EPA NARS manuals page. For details on the NLA 2022 survey design, see the NLA design documents page.
CHOOSING INDICATORS
The EPA used several indicators to assess the chemical, physical, recreational and biological condition of lakes, as well as characteristics that pose risks to human health. Although there are other indicators that could be used to describe lake condition, the EPA has determined that these align with the goals of the survey described earlier and are the most representative at a national scale (U.S. EPA 2009a). The NLA also included collection of data, such as environmental DNA and observations of cyanobacterial blooms, for research purposes or to provide additional context for assessments. Results for research indicators are not included in this report but will be posted on the NLA website as they become available. For this report, the EPA grouped indicators into five categories.
The trophic state indicator category has one indicator: Trophic state
There are three biological indicators:
There are five chemical indicators:
There are five physical indicators:
- Lake drawdown exposure | Lakeshore disturbance | Riparian vegetation cover | Shallow water habitat | Lake habitat complexity
Lastly, the survey included six human health indicators:
SELECTING LAKES
The EPA used a statistical sampling approach to select lakes for this assessment, to ensure that survey results were unbiased. For more information on statistical surveys, see What Are Probability Surveys? and Selecting a Sampling Design. The target population for the NLA was the set of lakes in the conterminous U.S. meeting the definition below.
End of side note.The 981 lakes sampled were identified using a statistical method called stratified random sampling. This approach is also used in social science and health fields to determine the status of populations, whether ecological, human or other. In such a design, lakes in the target population are stratified (categorized into groups, for instance, by size or location), and every lake has a known probability of being selected for sampling. The NLA 2022 design was stratified by state to ensure there were sites in every conterminous state.
The statistical design of the survey allows the EPA to extrapolate the results from the 981 lakes sampled to the 268,020 U.S. lakes meeting the definition above. Throughout this report, percentages reported for most indicators apply to the 268,020 lakes in the target population. For example, if the condition is described as poor for 10% of lakes nationally, this means that the number of lakes estimated to be degraded for that indicator is 26,802. For the fish tissue study, the EPA used a subset of the 981 sites. See the fish tissue section for more information.
To produce the results for each indicator, the EPA assigned each randomly selected site a weight based upon the total number of lakes that the site represented. This enabled the EPA to estimate the proportion of all lakes in each condition category (e.g., good, fair, poor). See the technical support document for details.
When designing the survey, the EPA considered the number of lakes that should be sampled. The greater the number of sites sampled, the more confidence in the results. The 981 sites sampled in NLA 2022 allow the EPA to determine the condition of lakes within a margin of error of approximately ±5%, with 95% confidence at the national scale. See Exhibit 1 for a map of the 2022 sampling sites and their distribution across ecoregions.
Map of NLA 2022 Sampling Sites in Each Ecoregion


EPA Region 9 crew member measuring water quality with a sensor at one of the National Eutrophication Survey lakes, California. Lareina Guenzel, EPA.
FIELD SAMPLING
To ensure consistency in collection procedures and to assure the quality of resulting data, field crews participated in online and in-person training, used standardized field methods and followed strict quality control protocols (U.S. EPA 2022).
Field crews spent a whole day collecting chemical, physical and biological data. At each lake, crews collected samples at multiple depths, at a mid-lake site reflecting the lake’s deepest point (or a site with a depth of 50 meters in deep lakes). From their boats, crews also collected samples in the littoral zone and recorded littoral and riparian (lakeshore) habitat observations at ten locations evenly distributed around the lake perimeter (see Exhibit 2 for details). To learn more about the NLA 2022 field sampling protocols, go to the NLA 2022 training videos playlist on YouTube.
Field Crew Sampling for NLA 2022

(1) Mid-lake, crews recorded temperature, pH and dissolved oxygen at multiple depths using an electronic sensor. They determined water clarity and light penetration by lowering a black and white disk called a Secchi disk. Near the surface (at depths up to 2 meters), they collected samples for atrazine, nutrients, chlorophyll a and cyanotoxins, using a long plastic tube. Also near the surface, they collected zooplankton with a fine mesh net. Lastly, they collected research indicator samples including phytoplankton and environmental DNA. (2) In the littoral zone, crews sampled benthic macroinvertebrates from the lake bottom with a D-frame dip net. They also took samples for enterococci bacteria and, again, environmental DNA. (3) From the boat, they recorded vegetation characteristics and signs of human disturbance in the littoral, shoreline and riparian zones.
ASSESSMENT BENCHMARKS
NLA analysts reviewed the raw data for each indicator independently and assigned the values in each dataset to categories (for example, "above benchmark" or "at or below benchmark," or good, fair or poor). To assign the appropriate condition category, NLA 2022 used two types of assessment benchmarks.
The first type consisted of fixed benchmarks based on values identified in the peer-reviewed scientific literature. For example, the EPA’s recommended water quality criterion was used nationally to classify lakes for microcystins.
The second type consisted of NLA-specific ecoregional benchmarks based on the distribution of indicator values from a set of reference lakes. The EPA chose this regional benchmark approach because lake characteristics in different ecoregions vary due to climate, geology and ecology, as well as human disturbance. For some indicators, environmental factors such as lake size and elevation were also used. Numerous scientific studies described in the technical support document, along with peer reviews of earlier NARS surveys, support the use of regional benchmarks to evaluate the condition of lakes and other types of waters (U.S. EPA 2024).
The steps below describe the EPA’s process for setting regional benchmarks and then determining lake condition. Exhibits 3-6 provide an example of how the phosphorus benchmark was derived for the Northern Appalachian ecoregion using concentrations observed at reference lakes. The process for other indicators and ecoregions was similar, resulting in regionally relevant benchmarks for each of the nine ecoregions (although values for most physical habitat indicators were based on scientific models rather than direct observations). See the NARS Reference Site Visualization Tool for the sites and data used to set benchmarks in all ecoregions. The EPA developed these benchmarks during earlier NLA assessments.
The technical support document provides indicator-specific details, including details on screening for reference lakes and the modeling approach used for the physical habitat indicators. See Appendix C of the technical support document for the NLA benchmarks.
1. Screen Lakes to Identify Reference Sites. First, NLA teams compiled lake information from the 2007 to 2017 NLA surveys for both the randomly selected lakes and a smaller set of hand-picked lakes thought to have low levels of human disturbance. EPA scientists evaluated these lakes by considering reference screening factors, such as chloride and sulfate concentrations and land use. Lakes that passed screening were considered less disturbed than others and were used in establishing the reference distribution (the range of conditions observed at reference sites, used to set benchmarks). Exhibit 3 shows a map of reference lakes in the Northern Appalachians ecoregion.
Reference Lakes in the Northern Appalachians Ecoregion

In the exhibit below, each dot indicates the observed phosphorus level (in parts per billion, or ppb) at one of the reference lakes. Many of the dots overlap because they have similar low phosphorus values.
Phosphorus Values of Northern Appalachian Reference Sites

2. Calculate Condition Benchmarks Using Reference Lake Data. The EPA then used the 75th and 95th percentiles of the reference lake phosphorus distribution to set the benchmarks for the condition categories (see the exhibit below).
Phosphorus Condition Benchmarks in the Northern Appalachians Ecoregion

3. Assign Condition Categories to NLA Lakes. Using those regional benchmarks, the EPA assigned the phosphorus condition (good/fair/poor) to each of the lakes that were randomly sampled as part of the NLA. As an example, the exhibit below shows the phosphorus value for each lake sampled in the Northern Appalachian ecoregion and the condition category in which it falls.
Phosphorus Values of Northern Appalachian Sites Randomly Sampled in 2022

The NLA assessment benchmarks have no legal effect and are not equivalent to individual state water quality standards. NLA condition categories also may not correspond to the categories states and Tribes use when they assess water quality relative to their specific water quality standards under the Clean Water Act. For example, a rating of poor condition under NLA does not necessarily mean a site is "impaired" as defined by state and Tribal water quality standards assessment protocols. To learn more about water quality standards, visit the EPA Water Quality Standards Academy. For additional information on state-specific and local water quality data and assessments, visit the EPA How’s My Waterway application.
National Results for Trophic State and Biological, Chemical and Physical Indicators
This chapter presents information on each of the NLA indicators. Each indicator section contains three parts: a brief explanation of why the indicator matters, results from the 2022 survey and changes in condition (particularly significant change since 2017). For more details on the benchmarks for each indicator, see the NLA 2022 Technical Support Document. To download raw data from the survey, visit the EPA NARS data page. Note that the 2012 and 2017 condition estimates reported here may differ from those in previous reports due to changes in benchmarks and statistical adjustments to population estimates made over time. All comparisons between earlier NLAs and NLA 2022 should be made using the new information presented in this report and the 2022 dashboard.
The graphs below show the estimated proportion of the nation’s lakes in each condition class and, for some indicators, the proportion not assessed. Exhibit 7 explains the graphical conventions used throughout this report to provide a point estimate and 95% confidence interval for each set of results displayed.
How to Read the Graphs in This Report

This image is an example of a graph showing the estimated percentage of lakes in each condition category in 2022. Similar conventions are used for graphs showing change between 2012 and 2022 and graphs (in a later chapter) showing attributable risk associated with stressors. In all graphs, values shown are rounded to the nearest whole number; however, calculations such as changes in condition are undertaken using more precise numbers. Consequently, readers may notice minor differences between values shown in the graphs and values provided in the text. Readers may also find that percentages across condition categories within a graph do not always total to 100%.
The graphs present national data, but each graph contains a customized link to ecoregional data. Visit the EPA NARS ecoregions page for maps and characteristics of each ecoregion.
TROPHIC STATE INDICATOR
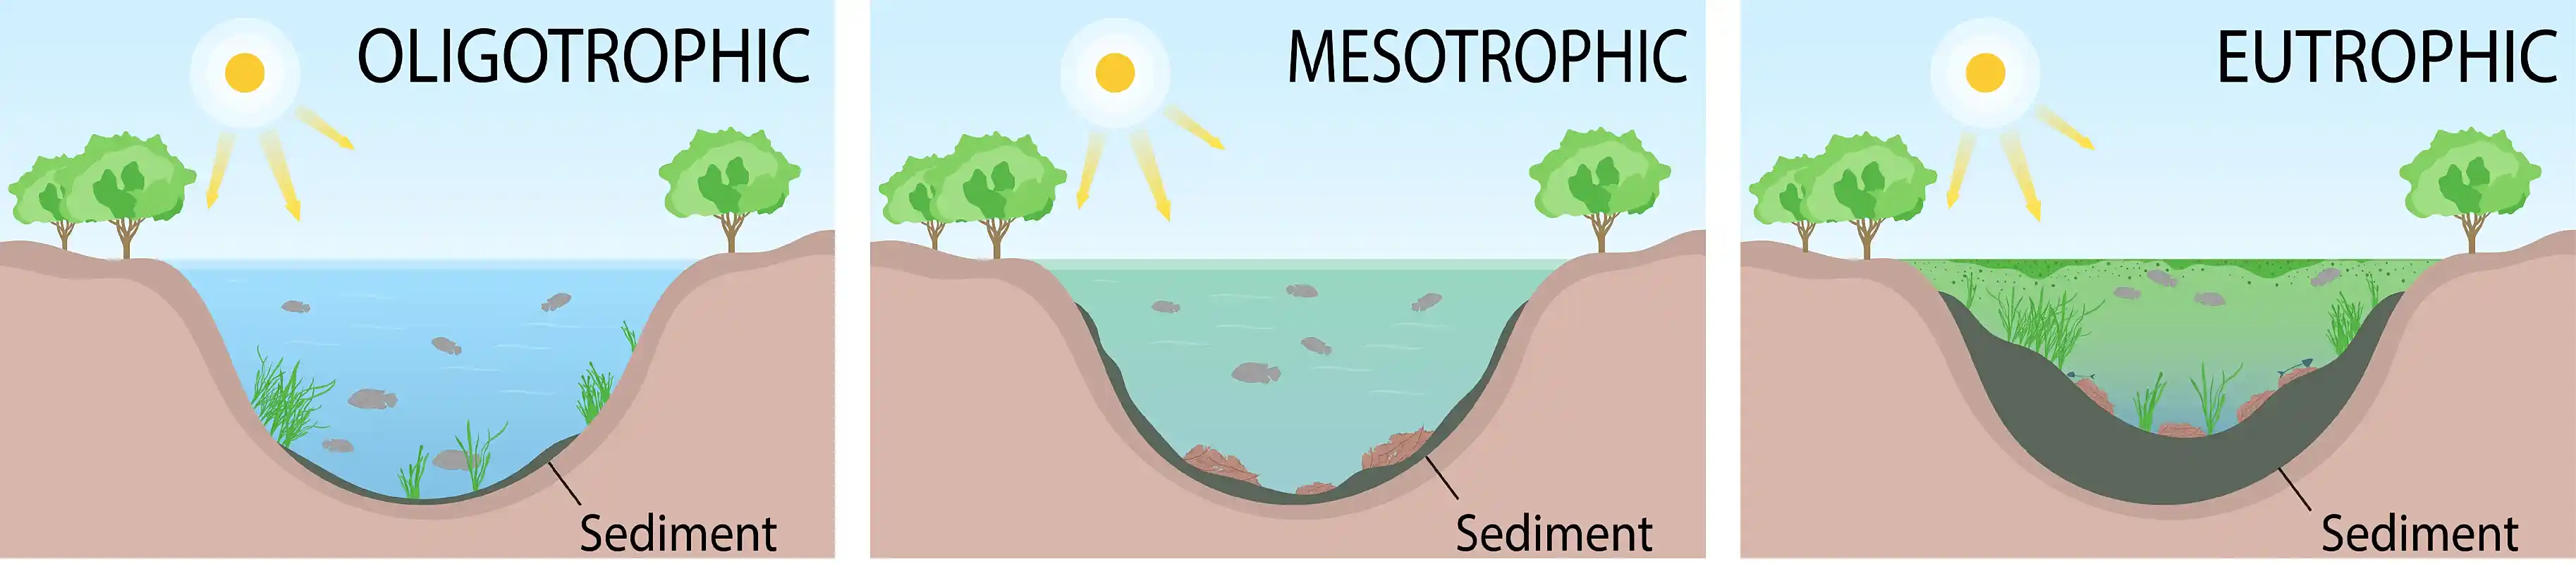
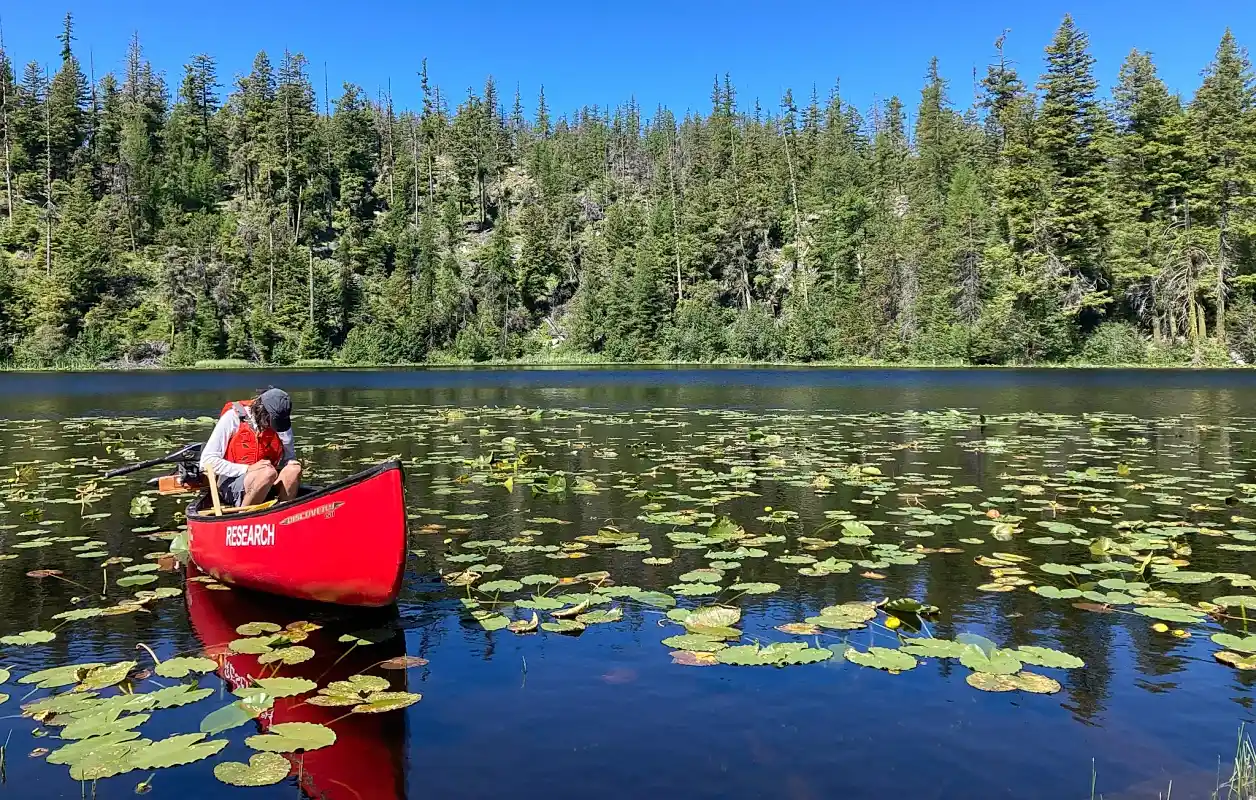
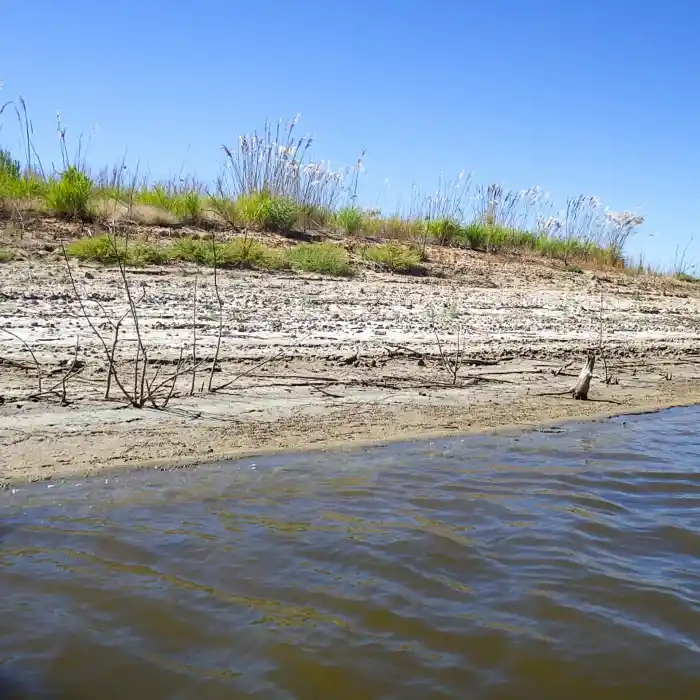
Trophic state progression over time. Some lakes begin with oligotrophic conditions, with clear water and low sediment levels, and may eventually experience eutrophic conditions, including murky water, plentiful algae and high sediment levels. Sediment in eutrophic lakes often contains high levels of undecayed organic material.
Trophic state is commonly used for classifying the biological productivity of lakes. It is often defined as the total amount of algae, estimated using chlorophyll a (where "algal" includes algae, cyanobacteria and other photosynthetic microorganisms). Lakes with high nutrient levels and high biological productivity are termed eutrophic, whereas lakes that have low concentrations of nutrients, low rates of productivity and generally low biomass, such as alpine lakes, are termed oligotrophic. Lakes that fall in between these two states are called mesotrophic. Hypereutrophic conditions are usually the result of human activity and can be an indicator of stress conditions.
Eutrophication occurs naturally as lakes age, on timescales of thousands of years. However, human activities can accelerate eutrophication and cause hypereutrophication and its undesirable effects, including nuisance algae, excessive plant growth, murky water, lower levels of dissolved oxygen, odor and fish kills.
To estimate the trophic status of lakes, EPA analysts compared chlorophyll a concentrations to literature-based benchmarks. The trophic state benchmark categories are listed below.
- Oligotrophic: chlorophyll a concentrations of ≤2 ppb.
- Mesotrophic: >2 ppb but ≤7 ppb.
- Eutrophic: >7 ppb but ≤30 ppb.
- Hypereutrophic: >30 ppb.
Eutrophication was widespread in NLA 2022: 30% of lakes were hypereutrophic and 43% were eutrophic. Oligotrophic lakes made up 7% of lakes. The percentage of lakes in oligotrophic condition by ecoregion ranged from <1% (Southern Plains) to 39% (Western Mountains).
No statistically significant changes occurred nationally from 2017 to 2022. Statistically significant changes in lake condition were observed for some survey subpopulations and are shown in the NLA dashboard.
BIOLOGICAL INDICATORS
The biology of a water body (the biological condition) can be characterized by the presence, number, and diversity of macroinvertebrates, algae and cyanobacteria, vascular plants, and other organisms. Together, they provide information about the health and productivity of the ecosystem. For the NLA, the EPA assessed three biological indicators: chlorophyll a, benthic macroinvertebrates and zooplankton. Assessing multiple communities provides a more complete assessment of biological condition.
Chlorophyll a
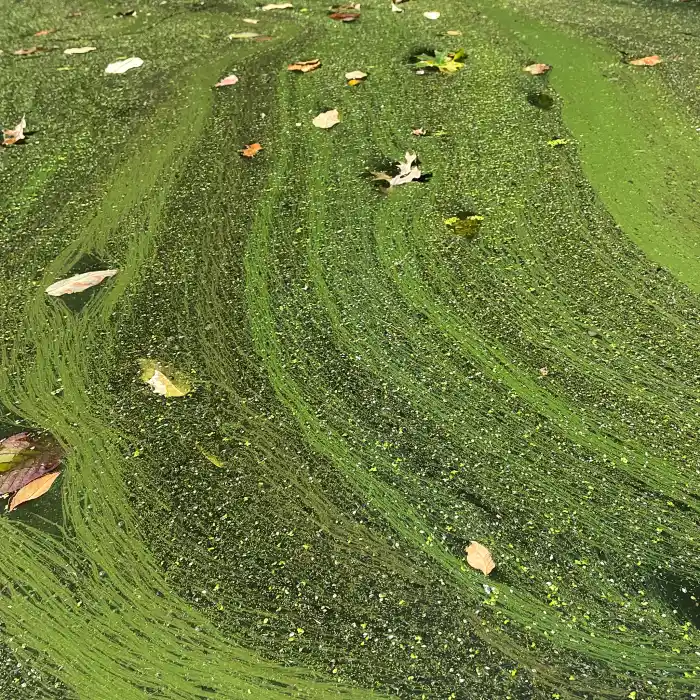
Filamentous algae and duckweed on a lake surface. Great Lakes Environmental Center.
Chlorophyll is a key component of photosynthesis, the process of making food from sunlight, carbon and water. Chlorophyll a is the predominant type of chlorophyll used by algae and cyanobacteria. It can therefore be used to measure the quantity of these organisms in a lake, as well as to classify trophic state. Although algae and cyanobacteria are a natural part of freshwater ecosystems, at high levels they can negatively affect dissolved oxygen levels and can cause aesthetic problems such as green scums and odors. Some algae and cyanobacteria also produce toxins that can be of public health concern at high concentrations. Waters with high levels of nutrients from fertilizers, manure, septic systems, sewage treatment plants and urban runoff may have high concentrations of chlorophyll a, algae and cyanobacteria.
The EPA compared chlorophyll a concentrations to regional benchmarks, in addition to the literature-based benchmarks for trophic state mentioned in the previous section. Comparing to regional benchmarks provides an understanding of lake productivity as it relates to the natural conditions that influence algal growth (such as nutrients, temperature and turbidity) and that are expected to vary nationally.
In 2022, 31% of lakes were rated good for chlorophyll a, 20% were rated fair and 49% were rated poor. The Coastal Plains ecoregion had a greater percentage of lakes rated good for chlorophyll a (45%) compared to national results.
No statistically significant changes occurred nationally from 2017 to 2022. Statistically significant changes in lake condition were observed for some survey subpopulations and are shown in the NLA dashboard.
Benthic Macroinvertebrates
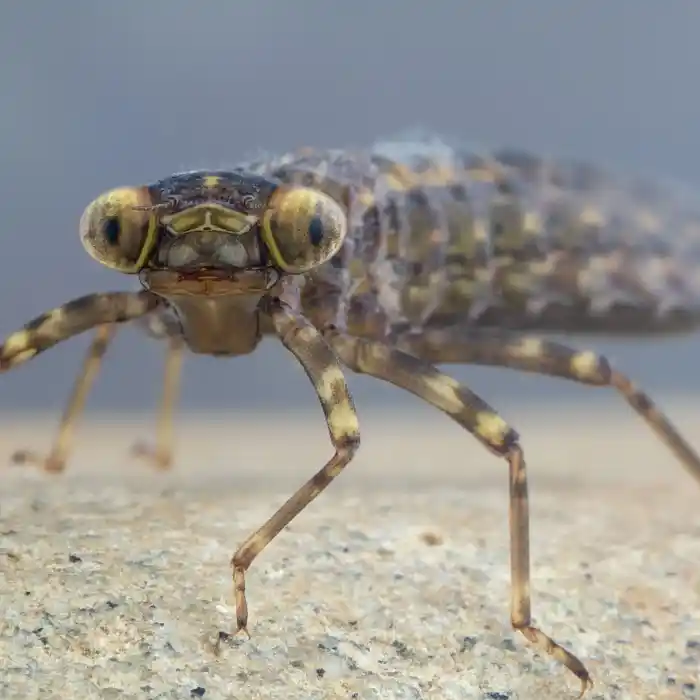
A dragonfly nymph.
Benthic macroinvertebrates include aquatic insect larvae and nymphs, small aquatic mollusks, aquatic worms, leeches, and crustaceans such as crayfish. They live among the rocks, sediments and vegetation on the lake bottom. These organisms were selected as indicators of biological condition because they spend most of their lives in water and their community structure responds to human disturbance. Given their broad geographic distribution, abundance and food web connections, they serve as good indicators of the biological quality of shoreline habitats in lakes.
The benthic macroinvertebrate indicator uses an index combining six different aspects of macroinvertebrate community structure: taxonomic composition; taxonomic diversity; feeding groups; habits/habitats; taxonomic richness; and pollution tolerance. The measures chosen for each of these aspects vary between ecoregions and are described in the technical support document.
Less than half of U.S. lakes, 42%, were rated good based on the benthic macroinvertebrate index, as shown below. Note that 3% of lakes were not assessed due to difficulties collecting samples from the nearshore area (for example, the lake bottom may have been bedrock, the nearshore area may have been too deep or other impediments may have prevented sampling).
No statistically significant changes occurred nationally from 2017 to 2022. However, statistically significant changes in lake condition were observed for some survey subpopulations and are shown in the NLA dashboard. For instance, in the Upper Midwest ecoregion the number of lakes in poor condition increased by 14 percentage points, from 7% to 21%.
Zooplankton
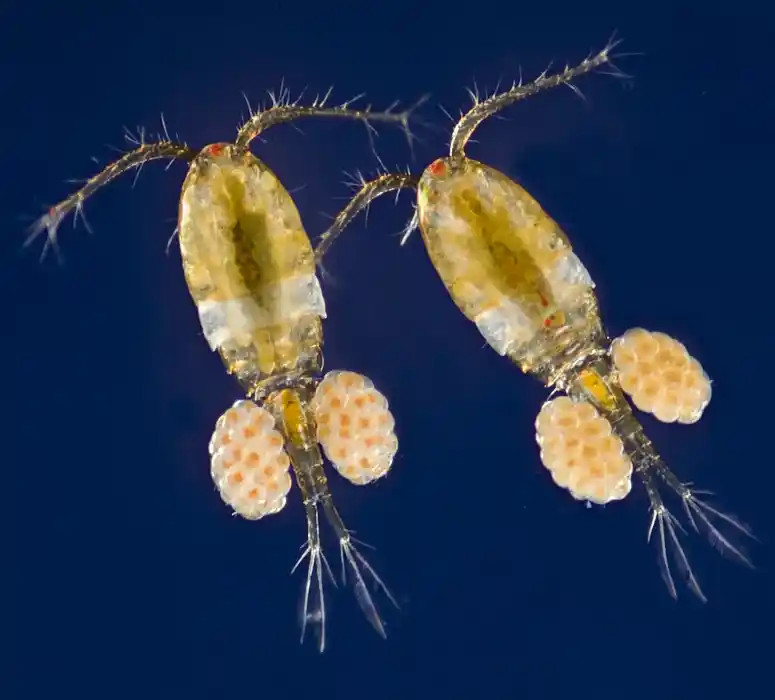
Copepods are a type of crustacean counted as part of the zooplankton indicator score calculation.
Zooplankton are small, often microscopic, animals in the water column that constitute an important element of the aquatic food web. These organisms serve an intermediary role in lake food webs, transferring energy from algae to larger invertebrate predators and fish. Zooplankton are sensitive to changes in the lake ecosystem. Given their broad geographic distribution, abundance and food web connections, these organisms serve as indicators of the biological quality of open water in lakes. To determine the zooplankton indicator score, NLA analysts combined six measures of community structure: abundance, taxonomic richness, trophic guild and data for three zooplankton taxa. The specific metrics chosen varied between the ecoregions.
Zooplankton condition was slightly better than benthic macroinvertebrate condition, with 48% of lakes in good condition.
There was no statistically significant change in condition nationally for zooplankton from 2017 to 2022. However, there were significant changes in several ecoregions. For instance, in the Western Mountains, the number of lakes in poor condition increased by 19 percentage points, from 10% to 29%.
CHEMICAL INDICATORS
For NLA 2022, the EPA assessed four chemical indicators: acidification of lakes, the herbicide atrazine, oxygen content and nutrient concentrations. The EPA compared sample results either to literature-based benchmarks (applied nationwide for acidification, atrazine and dissolved oxygen) or to regional benchmarks developed from a set of reference lakes in each ecoregion (for nutrients).
Acidification
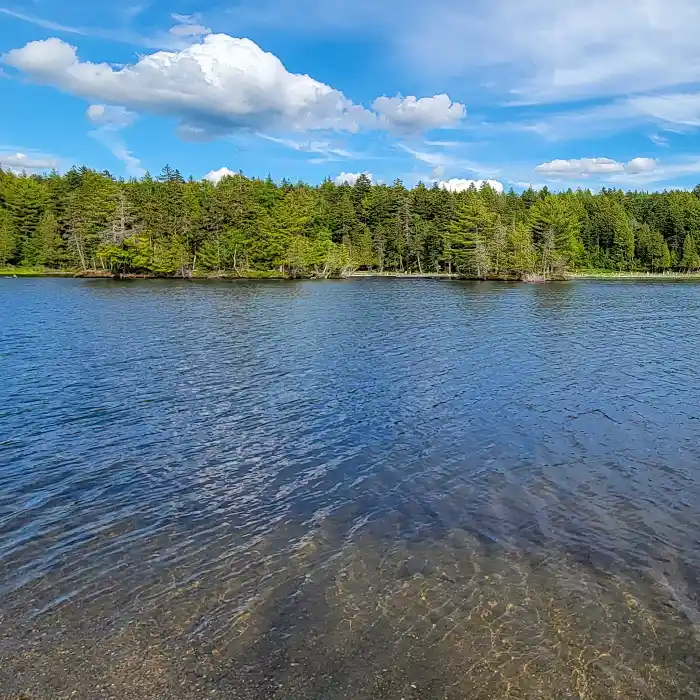
New England lakes like this one have historically been susceptible to acidification. Richard Mitchell, EPA.
Acid rain and acid mine drainage are major sources of acidifying compounds that can change the pH of lake water, impacting fish and other aquatic life. High acidity can, for instance, hinder shell formation in mollusks and crustaceans. Acid-neutralizing capacity, or ANC, serves as an indicator of sensitivity to changes in pH and is determined by the soil and underlying geology of the surrounding watershed. Lakes with high levels of dissolved bicarbonate ions (e.g., limestone watersheds) are able to neutralize acid depositions and buffer the effects of acid rain. Conversely, watersheds that are rich in granites and sandstones contain fewer acid-neutralizing ions and have low ANC; these systems are predisposed to acidification.
Most aquatic organisms function at the optimal pH range of 6.5 to 8.5. Sufficient ANC in surface waters will buffer acid rain and prevent pH levels from straying outside this range. In naturally acidic lakes, the ANC may be quite low, but the presence of natural organic compounds in the form of dissolved organic carbon, or DOC, can mitigate the effects of pH fluctuations.
ANC is measured using concentration units of microequivalents per liter (µeq/L), which account for the charges of the ions dissolved in the water. To classify lakes for acidification, the EPA considered ANC measurements along with DOC concentrations. Condition categories used in all ecoregions are defined below:
- Good: Lakes with ANC >50 µeq/L, or naturally acidic lakes with ANC ≤50 µeq/L and DOC ≥6 parts per million (ppm). Naturally acidic lakes are often associated with bog wetlands or certain types of swamps.
- Fair: Lakes with ANC >0 µeq/L but ≤50 µeq/L and DOC <6 ppm. These sites may become acidic occasionally, during periods of high precipitation.
- Poor: Lakes with ANC ≤0 µeq/L and DOC < 6 ppm.
Most lakes were in good condition for acidification; a small percentage of lakes were in fair (2%) and poor (<1%) condition. The Northern Appalachian ecoregion had the greatest percentage of lakes in fair condition (8%) for acidification.
No statistically significant changes occurred at the national level from 2017 to 2022.
Atrazine

Atrazine is widely used in growing corn and sorghum. Great Lakes Environmental Center.
Atrazine is an agricultural herbicide applied before and after planting to control broadleaf and grassy weeds. According to studies by the U.S. Geological Survey, atrazine is one of the most widely used herbicides and one of the most frequently detected in U.S. rivers (Stackpoole et al. 2021). Atrazine can also end up in lakes. Atrazine can affect plant growth and may be toxic to wildlife and humans. See the EPA’s atrazine indicator page for more information. The atrazine benchmark used in NLA 2022 is designed to ensure that atrazine levels will not cause significant changes in aquatic plant community structure, function and productivity.
Nationally, atrazine was detected in 41% of lakes. By ecoregion, detection ranged from 20% in the Western Mountains to 73% in the Temperate Plains. However, it was detected in 0.9% of lakes (about 2,430 lakes) at levels that pose a risk of affecting aquatic plant communities (according to the EPA concentration equivalent level of concern, 3.4 ppb, used to determine risk) (Farruggia et al. 2016). Over half of these exceedances occurred in the Temperate Plains.
The percentage of lakes where atrazine was detected increased significantly, by 11 percentage points, from 30% to 41%. The percentage of lakes with concentrations above the risk benchmark changed from 0.5% to 0.9%, but this difference was not significant.
Dissolved Oxygen
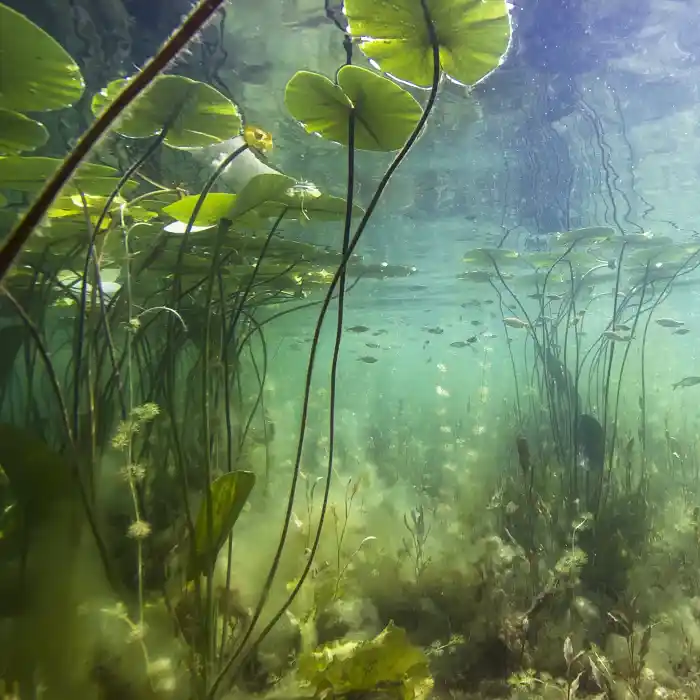
Aquatic plants add oxygen to lake water through photosynthesis, although some of that oxygen may get used up when dead plants decay.
Dissolved oxygen is considered an important measurement of water quality because it is essential for aquatic communities. Without oxygen, a lake would be devoid of all animal life. Changes in dissolved oxygen levels can occur for a variety of reasons, including water temperature, wind action and the amount of algae and aquatic plants in the lake. When algae and aquatic plants decay, the bacteria that decompose them use up dissolved oxygen. Excess algae can result in extensive bacterial growth and accompanying low oxygen levels. While fish can often swim away from areas with low oxygen, benthic macroinvertebrates may be trapped in low-oxygen zones. The EPA used the mean surface concentration (from the top 2 meters) to determine the condition class, using the same benchmarks in all ecoregions:
- Good: ≥5 ppm.
- Fair: >3 ppm but <5 ppm.
- Poor: ≤3 ppm.
Because oxygen levels can vary with depth, EPA scientists are researching a new indicator based on dissolved oxygen that would use additional data from a greater portion of the water column.
Although 72% of lakes had good oxygen levels in surface waters, 7% had poor levels nationally. The Northern Plains (85%) had a greater percentage of lakes with good oxygen levels in surface waters, compared to the national results.
Dissolved oxygen results did not change significantly from 2017 to 2022 in all categories. However, there were significant changes in some ecoregions. For instance, in the Western Mountains, the number of lakes in good condition decreased by 12 percentage points, from 96% to 84%.
Nutrients

EPA Region 4 crew members collecting water for nutrient analyses, Lake Okeechobee, Florida. Jon McMahan, EPA.
For this assessment, the EPA evaluated total phosphorus and total nitrogen, which are critical nutrients required for all aquatic life. In appropriate quantities, these nutrients power the primary algal production necessary to support lake food webs. Phosphorus and nitrogen are linked; they jointly influence both the concentrations of algae (and cyanobacteria) in a lake and the clarity of water. In many lakes, phosphorus is considered the limiting nutrient, meaning that the available quantity of this nutrient controls the pace at which algae are produced. This also means that modest increases in available phosphorus can cause rapid increases in algal growth. The naturally occurring levels of these indicators vary regionally, as does their relationship with turbidity and algal growth. For phosphorus and nitrogen, lakes were assessed relative to NLA-specific regional benchmarks.
Common sources of excess nutrients include sewage treatment plant discharge, septic systems, fertilizer used on lawns and farms, and animal waste. For more information see the EPA nitrogen and phosphorus indicator pages.
More lakes were in poor condition for nitrogen (47%) than in good condition (34%). In the Southern Plains ecoregion, only 5% of lakes were in good condition for nitrogen, and 83% of lakes were in poor condition.
Only of lakes had waters in good condition for nitrogen. This percentage was the lowest of any of the chemical indicators.
For more details, download the data for this chart, or visit the NLA dashboards for ecoregional data on nitrogen (total).
Phosphorus results were similar to nitrogen results, with 37% of lakes rated good and 50% rated poor. The percentage of lakes rated good ranged from 9% in the Southern Plains to 66% in the Coastal Plains ecoregion.
Only of lakes had waters in good condition for phosphorus. This percentage was the second lowest of the chemical indicators.
For more details, download the data for this chart, or visit the NLA dashboards for ecoregional data on phosphorus (total).
The percentage of lakes in good, fair and poor condition for nitrogen did not change significantly from 2017 to 2022. Statistically significant changes in condition were observed for some survey subpopulations and can be viewed in the NLA dashboard.
Nationally, the changes in condition observed for phosphorus from 2017 to 2022 were not statistically significant. Statistically significant changes were observed in some survey subpopulations and can be viewed in the NLA dashboard.
PHYSICAL INDICATORS
The condition of lakeshore habitat provides important information relevant to lake biological health. Human activities such as construction, urbanization, agriculture and removal of vegetation buffers can degrade lake condition. For NLA 2022, physical habitat condition was assessed based on field crew observations using five indicators: lake drawdown, lakeshore disturbance, riparian vegetation cover, shallow water habitat and habitat complexity.
Lake Drawdown Exposure
Large drawdown at a lake in Texas. University of Houston Clear Lake.
Lake drawdown, or the lowering or fluctuation of lake levels, can occur in both natural lakes and reservoirs. In many lakes, small amounts of drawdown may occur seasonally every year. Large drawdowns may result from direct or indirect manipulation of water levels for lake management purposes or from natural and human-caused climate changes that alter temperature, precipitation or runoff. Changing or significantly lowered lake water levels can adversely affect littoral and riparian habitat conditions and therefore also have an impact on biological communities. The NLA lake drawdown indicator measures whether water levels are lower than their full-lake stage.
Lake drawdown was small in most cases (79% of lakes). The percentage of lakes with large drawdown was 5%. Note that lake drawdown exposure results for 2022 include three condition classes (small, medium and large), a change from 2017. See the appendix for details.
Changes in condition from 2017 to 2022 were not calculated since three condition classes (small, medium and large) were used in 2022 and only two (not large and large) were calculated in 2017. Changes calculated for 2012 to 2022 can be viewed in the NLA dashboard.
Lakeshore Disturbance

Development along a lake can lead to increased nutrient and sediment input and increased runoff volumes. Development can also reduce available habitat for birds and wildlife. Northern Illinois. Great Lakes Environmental Center.
The lakeshore disturbance indicator reflects the extent and intensity of direct human alteration of the lakeshore itself. These disturbances can range from minor changes, such as the removal of a few trees to develop a picnic area, to major alterations, such as the construction of a large lakeshore residential complex. The effects of lakeshore development on lake quality include excess sedimentation; loss of native plants, vegetation structure and habitat complexity; and modifications to the materials on the bottom of the lake. These impacts can negatively affect fish, wildlife and other aquatic communities.
Lakeshore disturbance was widespread. Only 16% of lakes were rated good (i.e., had low levels of human disturbance), 50% were in fair condition and 34% were in poor condition. The percentage of lakes in good condition by ecoregion ranged from <0.05% in the Southern Plains to 46% in the Upper Midwest.
Lakeshore disturbance increased nationally from 2017 to 2022. The percentage of lakes in good condition decreased from 25% to 16%; this change was statistically significant. Statistically significant changes were also observed in some survey subpopulations and can be viewed in the NLA dashboard.
Riparian Vegetation Cover

Common beargrass flowers along St. Andrews Lake, Washington. Natural riparian vegetation can vary in complexity; in alpine areas, for instance, trees are not always present or occur in small numbers. Ecoregional benchmarks account for such variation. Washington State Department of Ecology.
Evaluation of riparian, or lakeshore, vegetation cover is based on observations of three layers of vegetation: understory grasses and forbs, mid-story woody and non-woody shrubs, and overstory trees. Healthy, multilayered vegetation covering this corridor can buffer the effects of human disturbance. Cover can slow runoff; filter nutrients and sediments; reduce erosion along lake shorelines; shade water, reducing algae growth; and supply leaf litter, branches and logs that serve as food and habitat. Generally, shorelines are in better condition when vegetation cover is high in all layers; however, not all three layers occur in all areas of the country. For example, in the Northern Plains there is typically no natural overstory tree cover; in the West, steep rocky shores are the norm for high-mountain or canyon lakes. These natural features have been factored into the calculation of the riparian vegetation cover indicator score.
Just over half of lakes (52%) had high (good) levels of riparian vegetation cover; 27% had low (poor) cover. In the Northern Plains ecoregion, only 6% of lakes had high levels of riparian vegetation cover and 79% had low cover.
The percentage of lakes in good, fair and poor condition for riparian vegetation cover did not change significantly from 2017 to 2022. Statistically significant changes were observed in some survey subpopulations and can be viewed in the NLA dashboard.
Shallow Water Habitat
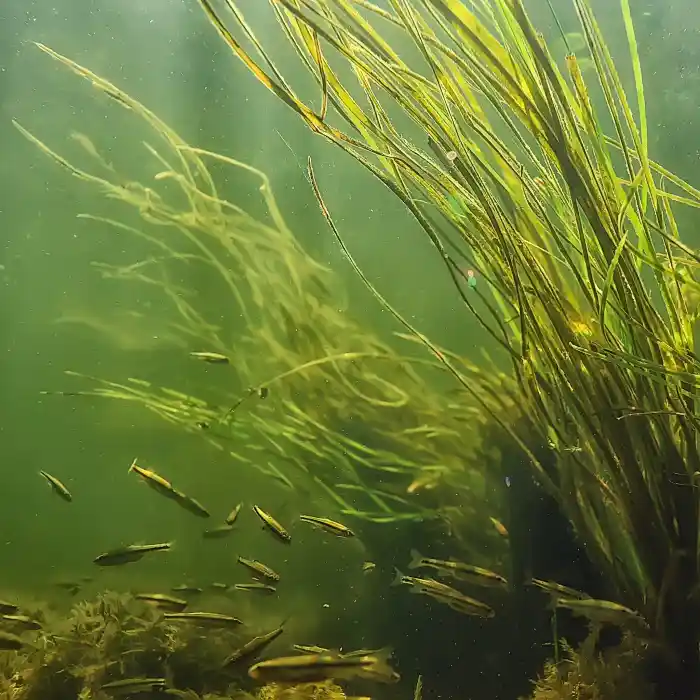
Shallow water vegetation provides shelter for fish and macroinvertebrates.
The shallow water habitat indicator examines the quality of the shallow edge of the lake, or littoral zone, using data on the presence of living and non-living features such as overhanging vegetation, aquatic plants, large woody snags, brush, boulders and rock ledges. Lakes with greater and more varied shallow water habitat typically support aquatic life more effectively because they have many complex ecological niches. Like the riparian vegetation cover indicator, the shallow water indicator is based on conditions in reference lakes and is modified regionally to account for differing expectations of natural condition.
Nationally, shallow water habitat was rated good in 55% of lakes. The Western Mountains ecoregion had the greatest percentage of lakes (71%) rated good for shallow water habitat.
Shallow water habitat condition declined from 2017 to 2022; the percentage of lakes with good condition decreased by 9.4 percentage points, from 64.6% to 55.2%. The percentage of lakes with fair condition increased from 19% to 26%. These changes were statistically significant.
Lake Habitat Complexity

Multiple types of littoral vegetation and dense riparian forest indicate complex lakeshore habitat. Phil Kaufmann, EPA.
The habitat complexity indicator combines the riparian vegetation cover and shallow water habitat indicators described above to estimate the amount and variety of all cover types at the water’s edge, including those on land and in water. High complexity indicates the availability of more ecological niches for macroinvertebrates and fish.
Like the two indicators that comprise the habitat complexity indicator, this indicator is based on conditions in reference lakes and is modified regionally to account for differing expectations of natural condition.
Just over half (51%) of the nation’s lakes had high (good) habitat complexity scores and 30% had low (poor) scores.
The percentage of lakes in good, fair and poor condition for lake habitat complexity did not change significantly from 2017 to 2022. Statistically significant changes were observed in some survey subpopulations and can be viewed in the NLA dashboard.
National Results for Human Health Indicators
In addition to physical, chemical and biological indicators of the quality of the nation’s lakes, NLA 2022 included data collection for six human health indicators: two cyanotoxins (microcystins and cylindrospermopsin), the fecal contamination indicator enterococci and three contaminants in fish tissue (mercury, PCBs and PFAS).
For cyanotoxins and enterococci, the results were compared to the EPA’s recommended water quality criteria or benchmarks designed to protect human health against recreational exposure such as swimming or boating. For mercury, the results were compared to the EPA’s recommended national fish tissue-based water quality criterion for methylmercury. For PCBs, the EPA derived fish tissue screening levels and compared the fish tissue results to these screening levels. For PFAS, the EPA determined the percentage of lakes where a selected group of PFAS were detected.
The results described below provide national- and some regional-scale estimates for these indicators. For information on state-specific and local water quality data and assessments, visit How’s My Waterway. The public should check with state, Tribal or local agencies for swimming, boating or fishing advisories in specific lakes.
CYANOTOXINS
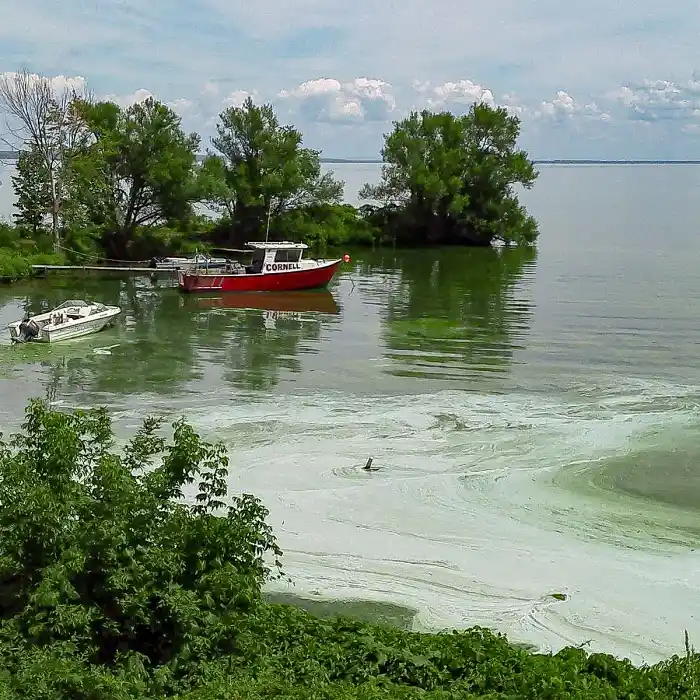
Algal bloom on Oneida Lake, New York. National Environmental Education Foundation, Amy H. Flickr, CC BY 2.0 DEED. Modified.
Cyanobacteria (historically called blue-green algae) are one-celled photosynthetic organisms that normally occur at low levels. Under eutrophic conditions, cyanobacteria can multiply rapidly (see trophic state and chlorophyll a above). Not all cyanobacterial blooms are toxic, but some may release toxins such as microcystins and cylindrospermopsin. Recreational exposure is typically a result of inhalation, skin contact or accidental ingestion. Health effects of exposure include skin rashes, eye irritation, respiratory symptoms, gastroenteritis and, in severe cases, liver or kidney failure and death. Pets are also susceptible to health effects from exposure to these toxins. See the EPA cyanotoxins page for more information.
The EPA has set recreational freshwater criteria and swimming advisory recommendations for microcystins and cylindrospermopsin: 8 ppb and 15 ppb, respectively (U.S. EPA 2019). Note that some types of algae and cyanobacteria release other toxins not monitored as part of the NLA. The NLA assesses risk of exposure to microcystins and cylindrospermopsin at national and regional levels. For information about risks at specific locations, recreational water users should check with state, Tribal or local governments before swimming, boating or fishing. See the EPA State and Tribal Harmful Algal Bloom Resources page for more information.
Microcystins were detected in 50% of lakes in 2022. The detection of microcystins in the ecoregions ranged from 29% to 71%. Levels exceeded the EPA’s recreational criterion in 2% of lakes, representing 5,915 lakes nationally.
For more details, download the data for this chart, or visit the NLA dashboards for ecoregional data on microcystins risk.
Cylindrospermopsin was detected in 12% of lakes. Concentrations did not exceed the EPA’s criterion recommendation of 15 ppb.
For more details, download the data for this chart, or visit the NLA dashboards for ecoregional data on cylindrospermopsin risk.
The percentage of lakes where microcystins were detected increased by almost 30 percentage points in 2022, from 21% to 50%. This change was statistically significant. The percentage of lakes above the EPA criterion did not change significantly.
The percentage of lakes where cylindrospermopsin was detected did not change significantly from 2017 to 2022 (see the dashboard). The percentage of lakes above the EPA criterion also did not change.
ENTEROCOCCI BACTERIA

Enterococci bacteria may be present in urban or suburban areas, where hard surfaces prevent absorption by soil. Sources of bacteria could include pets or wildlife. Natalie Auer.
Enterococci are bacteria that live in the intestinal tracts of warm-blooded animals, including humans. While not considered harmful to humans, their presence in water indicates that disease-causing microbes may be present. Enterococci are therefore used as indicators of possible fecal contamination from sources such as wastewater treatment plant discharges, leaking septic systems, and storm water runoff containing pet and livestock waste. For NLA, water samples were analyzed using a method that measures enterococci DNA (qPCR, or quantitative polymerase chain reaction). Results were compared to an EPA benchmark (1,280 calibrator cell equivalents per 100 milliliters) included in the EPA’s recommended recreational criteria document for protecting human health in ambient waters designated for swimming (U.S. EPA 2012).
Enterococci exceeded the EPA benchmark in 7% of lakes. Enterococci data were not collected in 2012 or 2017, so no change data are available.
FISH TISSUE CONTAMINATION IN LAKES
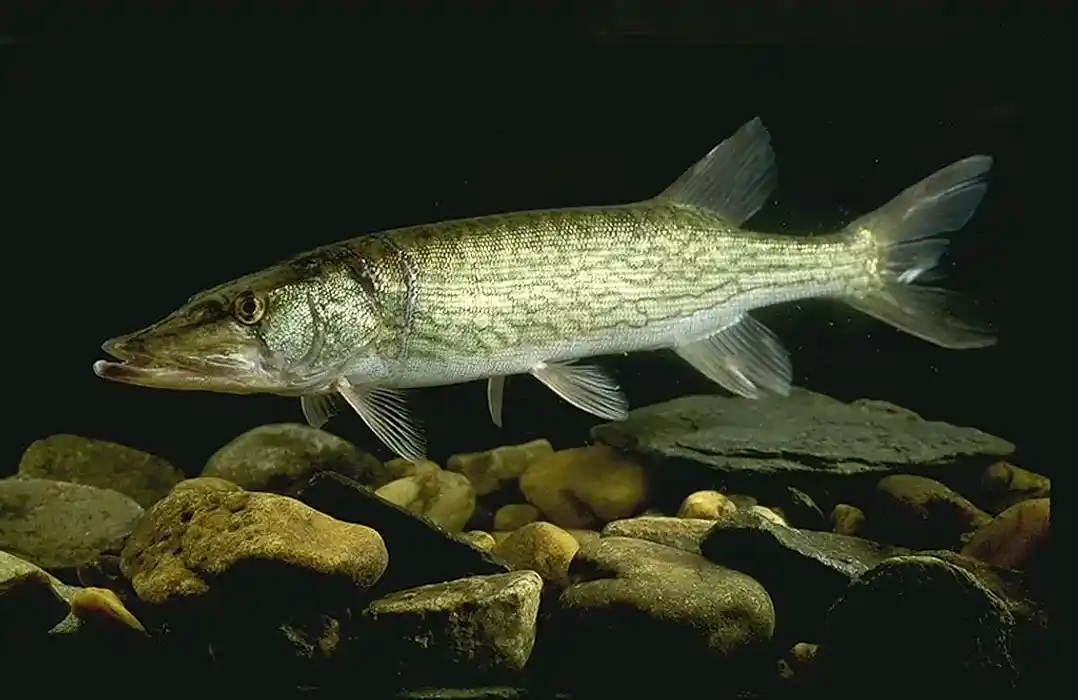
Chain pickerel, one of the target species for fish tissue collection. Ken Hammond, USDA. Flickr.
Fish can be an important source of protein and essential fatty acids in the diet, especially for communities with high-frequency fish consumers such as subsistence fishers, some recreational fishers, or some fishers in underserved communities. However, contaminants in the environment can accumulate in fish. At high enough levels, these accumulated contaminants may contribute to cancer as well as developmental, neurological or other health impacts in people who eat fish. Limiting consumption of certain fish can reduce human exposure to contaminants. People should consult local fish consumption advisories to determine whether the fish they have caught are safe to eat. The EPA maintains a list of state and Tribal contacts for such advisories.
As part of NLA 2022, the EPA studied contamination in fish from lakes to determine whether consumption poses risks to human health. This is the first time the fish tissue indicator was included as part of the NLA. See the technical support document (U.S. EPA 2024) for more information on this study.
The sampling approach for this study involved collecting multiple fish at each of a subgroup of NLA sites, targeting approximately two-thirds of the lakes (636 lakes). At each lake designated for fish collection, field crews attempted to collect fish species commonly caught and consumed by recreational and subsistence fishers, combining caught fish into one composite sample per lake.
At the laboratory, the whole fish composite samples were scaled and filleted, and the fillets were ground. Finally, the EPA analyzed these fillet composite samples for total mercury, total PCBs, and 40 PFAS (a list of PFAS analyzed is provided in the technical support document).
Note that contaminant results for the fillet composite samples are reported only for the lakes where fish were caught (a total of 413 lakes), representing a "sampled population" of 58,747 lakes. The results cannot be extrapolated to the full NLA target population of 268,020 lakes.
Mercury
About 80% of all fish consumption advisories in the United States involve mercury. Most mercury in water comes from air deposition related to coal combustion and waste incineration. Airborne mercury, mostly from these sources, falls to land and is washed into lakes. People are exposed to methylmercury (the most toxic form of mercury) primarily by eating fish and shellfish. Fetal or early childhood exposures can occur in the womb or while nursing, respectively, and can lead to impaired neurological development. Exposure to unsafe levels of methylmercury can also affect adult health, leading to cardiovascular disease, loss of coordination, muscle weakness, and impaired speech and hearing. The EPA applies the conservative assumption that all mercury in fish is methylmercury and therefore measures total mercury in fillet tissue to be most protective of human health.
Mercury levels in fillet composite samples were compared to the EPA’s recommended fish tissue-based water quality criterion for methylmercury of 300 ppb to identify potential human health risks from consumption of locally caught lake fish.
What was the condition in 2022?
Mercury was detected in 100% of the 413 fish fillet composite samples analyzed for NLA 2022.
Mercury concentrations in fish fillet samples exceeded the recommended criterion of 300 ppb in 51% of lakes in the sampled population (see Exhibit 41).
Percentage of Lakes with Fillet Mercury Concentrations Above 300 ppb
51% of the sampled population of 58,747 lakes had fish with mercury concentrations above the EPA criterion of 300 ppb.
Polychlorinated Biphenyls (PCBs)
PCBs accumulate in the tissues of aquatic organisms and are known to cause cancer in animals. Based on those findings and additional evidence from human studies, the EPA classifies PCBs as a probable human carcinogen. Other potential human health effects that could result from higher dietary exposure to PCBs include liver disease and reproductive impacts, along with neurological effects in infants and young children. The production of PCBs in the U.S. has been banned for over four decades, but they persist in the environment.
For PCBs, the EPA developed human health fish tissue screening levels, expressed as a threshold level of a particular contaminant in fillet tissue (nanograms per gram, or ppb), for three groups of consumers:
- High-frequency fish consumers, based on a fish consumption rate of four to five 8-ounce meals of locally caught fish per week.
- General fish consumers, based on a fish consumption rate of one 8-ounce meal per week.
- Reduced-frequency fish consumers, based on a fish consumption rate of one 8-ounce meal per month.
See the technical support document for details on the derivation of human health fish tissue screening levels.
Cancer health effects can occur at lower PCB levels than noncancer health effects, so applying a lower screening level to reduce the risk of cancer health effects from dietary exposure to PCBs also reduces risks of noncancer health effects. For NLA 2022, the EPA therefore used the more protective cancer human health fish tissue screening levels for total PCBs to characterize human health risks at various levels of fish consumption. For general fish consumers, the EPA applied a cancer screening level of 12 ppb for total PCBs in fish fillets. For high-frequency fish consumers, the EPA applied a cancer PCB screening level of 2.8 ppb. Lastly, for reduced levels of consumption, the EPA applied a cancer screening level of 54 ppb.
What was the condition in 2022?
PCBs were detected in 100% of the 413 fish fillet composite samples analyzed for NLA 2022.
Total PCB concentrations in fish fillet samples exceeded the cancer screening level for general fish consumers of 12 ppb in 6% of lakes in the sampled population (see Exhibit 42). PCB concentrations in fillets exceeded the cancer screening level of 2.8 ppb for high-frequency fish consumers in 23% of lakes. Results for reduced-frequency fish consumers showed that fish fillet samples from only 2% of lakes exceeded the screening level of 54 ppb.
Percentage of Lakes with Fillet Total PCB Concentrations Above 12 ppb
6% of the sampled population of 58,747 lakes had fish with total PCB concentrations above the EPA’s cancer screening level of 12 ppb. This screening level is based on general fish consumption (one 8-ounce meal per week).
Per- and Polyfluoroalkyl Substances (PFAS)
PFAS are a group of synthetic chemicals used in the manufacture of many products, including non-stick cookware, food packaging, waterproof clothing, and stain-resistant carpeting. PFAS are toxic and persistent in the environment. Most people in the United States have been exposed to PFAS and have PFAS in their blood, especially perfluorooctane sulfonic acid (PFOS) and perfluorooctanoic acid. Certain PFAS levels have been linked to immune, cardiovascular, hepatic (liver), and developmental health effects such as decreased fertility or low birth weight, as well as an increased risk of certain cancers.
Results for the full set of 40 PFAS included in the fish fillet tissue analyses for NLA 2022 are presented in Table 9-2 of the technical support document accompanying this report.
What was the condition in 2022?
At least one type of PFAS was detected in 93% of the 413 fish fillet composite samples analyzed for NLA 2022. Among the most common, each detected in at least 20% of the samples, were these eight PFAS:
- Perfluorooctane sulfonic acid (PFOS).
- Perfluorononanoic acid (PFNA).
- Perfluorodecanoic acid (PFDA).
- Perfluorodecane sulfonic acid (PFDS).
- Perfluoroundecanoic acid (PFUnA).
- Perfluorododecanoic acid (PFDoA).
- Perfluorotridecanoic acid (PFTrDA).
- Perfluorotetradecanoic acid (PFTeDA).
Sixteen of 40 tested PFAS were not detected in any of the fillet composite samples.
The PFAS detection frequencies in fillet tissue correspond to estimates of the number of lakes in the sampled population containing fish with detectable levels of PFAS. Exhibit 43 shows the estimated percentage of the sampled population with detectable PFAS in fish tissue, for the PFAS listed above.
Estimated Percentage of Lakes in the Sampled Population (n=58,747) with Detectable PFAS in Fish Tissue
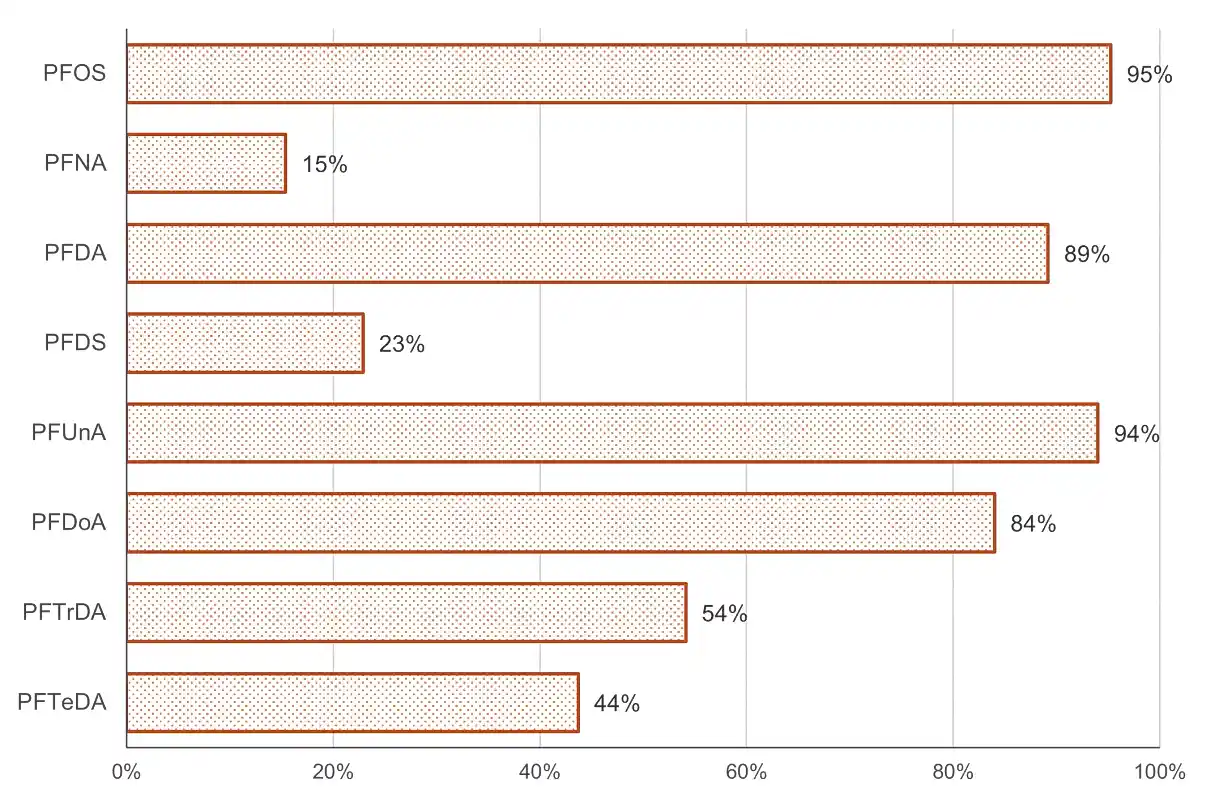
Each of these eight PFAS was present in at least 20% of the fish tissue samples and is estimated to be present in fish in at least 15% of the sampled population of lakes. This exhibit lists the PFAS in order of increasing carbon chain length, with PFTeDA being the longest. Chain length affects the tendency of PFAS to dissolve in water and to accumulate in animal tissues.
Associations Between
Stressors and Biological Condition
A crew member holds a D-shaped net used to sample benthic macroinvertebrates, California. Moss Landing Marine Labs.
Restoring lake quality requires not only an understanding of current condition and change over time, but also of stressors associated with degraded biological condition and the potential for improved conditions when stressors are reduced. This knowledge can help decision makers prioritize stressors for reduction.
Potential stressors for the NLA included the chemical and physical measures characterized by the indicators in the previous chapter, along with the biological indicator chlorophyll a. Cyanotoxin and atrazine detection were included, but cyanotoxin and atrazine benchmark exceedances were not, as these benchmarks do not measure effects on benthic macroinvertebrates or zooplankton. At the national and regional level, the EPA performed three calculations for each stressor:
- Determined the extent of lakes in poor condition for each stressor (the relative extent).
- Evaluated the extent to which poor biological condition was more likely when a stressor or indicator was rated poor (the relative risk).
- Assessed the potential improvement that could be achieved by reducing or eliminating the stressor (the attributable risk).
Highlights of the national results on relative extent, relative risk and attributable risk for the benthic macroinvertebrate indicator are described below, along with highlights on selected subpopulations. Note that only stressors for which the attributable risk was above zero are shown. Visit the NLA dashboards to further explore risk results nationally and for the following survey subpopulations: the Mississippi River basin, three aggregated ecoregions, and natural lakes and reservoirs. For more information on these analyses visit the NARS risk web page.
In 2022, the NLA indicators with the highest relative extent estimate nationally were phosphorus (50%), chlorophyll a (49%), nitrogen (47%) and atrazine detection (41%).
Acidification was the stressor with the highest relative risk estimate nationally (3.4). That is, lakes with poor ratings for acidification were about 3.4 times more likely to have poor benthic macroinvertebrate condition. Riparian vegetation cover, lake habitat complexity, phosphorus, dissolved oxygen and lakeshore disturbance had relative risks of 1.5 or greater. When calculated for survey subpopulations rather than at the national level, relative risk estimates were as high as 9.2, such as for total phosphorus in the Western Region (i.e., combined Western Mountains and Xeric ecoregions).

A New England lake. Hilary Snook, EPA.
Combining the relative extent and relative risk values for each indicator into a single value provides the attributable risk. Attributable risk analysis estimates the percentage of lakes in poor biological condition that could improve to either good or fair condition if the stressor were reduced (i.e., changed from poor to fair or good).
Calculating attributable risk involves the following assumptions: 1) a causal relationship between a stressor and biological condition exists; 2) a lake’s poor biological condition would be reversed if the stressor were improved to fair or good levels; and 3) the stressor’s impact on a lake’s biological condition is independent of other stressors. Despite these potential limitations, attributable risk can provide general guidance as to which stressors might be higher priorities for management nationally or regionally.
EPA found that reducing phosphorus could result in the greatest benefit to benthic macroinvertebrate condition nationally, as shown in Exhibit 44. This exhibit shows attributable risk (including point estimates and 95% confidence intervals) for each stressor. If poor phosphorus condition were improved to fair or good, a 27% reduction in the number of lakes in poor benthic macroinvertebrate condition could occur.
Attributable Risk From Exposure to Stressors Across All Lake Types (2022)
The EPA estimates that reducing total phosphorus levels (by improving condition to fair or good) could reduce the number of lakes in poor condition for benthic macroinvertebrates by 27%, as shown by the lighter, shorter bar. The longer, darker bar represents the margin of error around each estimate. The EPA is 95% confident that the attributable risk value in the national population falls within this confidence interval.
The potential for improved biological condition in each subpopulation will differ from the national potential due to differences in poor biological condition and relative risk results. Attributable risk results for some lake subpopulations (e.g., natural lakes and reservoirs) suggest that a slightly greater percentage of natural lakes in poor biological condition (compared to lakes nationally) might improve if poor nutrient conditions were improved (30% for total phosphorus) (Exhibit 45).
Attributable Risk From Exposure to Stressors in Natural Lakes (2022)
In natural lakes, reducing phosphorus levels could reduce the number of lakes in poor condition for benthic macroinvertebrates by 30%. Attributable risk is calculated using values for relative extent and relative risk.
In reservoirs, poor biological condition might be improved more by improving habitat, as suggested by the attributable risk estimate of 38% for lake habitat complexity (Exhibit 46).
Attributable Risk From Exposure to Stressors in Reservoirs (2022)
In reservoirs, increased quality of riparian vegetation and shallow water habitat could reduce the number of lakes in poor condition for benthic macroinvertebrates by 38%.
To see graphs for relative extent, relative risk and attributable risk together, visit the risk estimate section of the NLA dashboard.
The EPA also evaluated attributable risk for zooplankton nationally. Phosphorus and nitrogen had the highest attributable risk, each at 18%. Additional zooplankton attributable risk results are available on the NLA dashboard.
Conclusion
EPA Region 8 crew member collecting a water sample at New Castle Reservoir, Utah. Richard Mitchell, EPA.
The NLA provides findings that lake managers can use to inform resource management priorities and strategies. Nationally, less than half of lakes were in good condition based on assessments of benthic macroinvertebrates and zooplankton (42% and 48%, respectively). Half of lakes were in poor condition for phosphorus, while 47% and 48% of lakes exhibited poor conditions for nitrogen and chlorophyll a, respectively. Other widespread stressors include lakeshore disturbance, lake habitat complexity and riparian vegetation cover (34%, 30% and 27% of lakes were in poor condition, respectively). These results suggest the need to continue our collective investments in controlling nutrients and improving habitat in and around our nation’s lakes.
While the survey results provide national and regional estimates of lake condition, they do not address all information needs at all scales. For example, the survey does not measure all stressors and has limited usefulness for inferring local condition. In-depth monitoring and analysis of individual lakes and watersheds are required to support specific restoration and protection efforts.
The EPA and its state and Tribal partners are continually refining the NLA and will apply lessons learned to determine the need for changes to the design, indicators, field methods, laboratory methods and analysis procedures in the next NLA. Sampling for the next NLA will take place in the summer of 2027.
NLA 2022 would not have been possible without the involvement of state and Tribal scientists and resource managers. The EPA will continue to work with these partners to translate the expertise gained through these national surveys to studies of their own waters. Additionally, the EPA will support use of the NLA data to evaluate the success of efforts to protect and restore water quality.
End of side note.About This Report
This is the final version of the report, published in August 2024. Any corrections or updates to the final report will be described in this section. Results presented in the report and NLA dashboard were last updated 08/14/2024.
A suggested citation for the report is provided below: U.S. Environmental Protection Agency. 2024. National Lakes Assessment: The fourth collaborative survey of lakes in the United States. EPA 841-R-24-006. U.S. Environmental Protection Agency, Office of Water and Office of Research and Development. https://nationallakesassessment.epa.gov/webreport
Appendix: Changes to the NLA Survey Since 2017
Although most aspects of the survey remained the same in 2022, the EPA implemented some improvements for this iteration of the survey and report. This appendix describes changes since NLA 2017. They include new reporting on three NARS indicators that have been part of other NARS surveys for several years and one benchmark update.
For NLA 2022, the EPA added the following NARS indicators:
- Enterococci bacteria. Enterococci have been a recreational use indicator for two other NARS surveys: the National Rivers and Streams Assessment and National Coastal Condition Assessment. This is the first time the indicator has been reported in the NLA.
- Cylindrospermopsin. NLA 2017 was the first NARS survey to analyze samples for cylindrospermopsin. Given the low detection frequency and criteria exceedance associated with the NLA 2017 results, the EPA chose to review data from a second sampling season to ensure there were no sampling or analytical problems before publishing national results. After obtaining similar results during National Rivers and Streams Assessment 2018-19, the EPA confirmed the low detection rates were accurate.
- Fish Tissue Contaminants. Twenty years ago, the EPA conducted a national-scale study of fish tissue contamination in U.S. lakes (U.S. EPA 2009b). NLA 2022 provided an opportunity to repeat a national lake survey with methods consistent with the first lake tissue study. EPA has conducted similar studies for the National Rivers and Streams Assessment and National Coastal Condition Assessment.
Additionally, the lake drawdown exposure results are presented as "large", "medium" and "small" for 2022. In 2017, results included "large" or "not large" because data from hundreds of lakes did not allow data analysts to distinguish medium from small drawdown classes.
For details on these updates, see the NLA 2022 Technical Support Document.
For this report, the EPA recalculated the results from prior surveys, taking all the changes above into account, to facilitate comparison between the 2012, 2017 and 2022 results. The results from prior surveys presented in this report therefore differ from the results presented in the original reports. Readers wishing to compare 2022 results to prior surveys should use this report and the NLA 2022 dashboard, not the original reports.
References
Farruggia, F., C. Rossmeisl, J. Hetrick, M. Biscoe. 2016. Refined ecological risk assessment for atrazine. U.S. Environmental Protection Agency, Office of Pesticide Programs, Environmental Fate and Effects Division, Environmental Risk Branch III. https://www.regulations.gov/document/EPA-HQ-OPP-2013-0266-0315
Stackpoole, Sarah M., Megan E. Shoda, Laura Medalie and Wesley W. Stone. 2021. Pesticides in U.S. rivers: Regional differences in use, occurrence and environmental toxicity, 2013 to 2017. Science of the Total Environment 787:147147. https://doi.org/10.1016/j.scitotenv.2021.147147
U.S. Environmental Protection Agency. 2009a. National Lakes Assessment: A collaborative survey of the nation’s lakes. EPA 841-R-09-001. U.S. Environmental Protection Agency, Office of Water and Office of Research and Development. https://www.epa.gov/sites/production/files/2013-11/documents/nla_newlowres_fullrpt.pdf#page=26
U.S. Environmental Protection Agency. 2009b. The national study of chemical residues in lake fish tissue. EPA-823-R-09-006. U.S. Environmental Protection Agency, Office of Water, Washington, DC. https://www.epa.gov/sites/default/files/2018-11/documents/national-study-chemical-residues-lake-fish-tissue.pdf
U.S. Environmental Protection Agency. 2012. Recreational water quality criteria. EPA 820-F-12-058. U.S. Environmental Protection Agency, Office of Water, Washington, DC. https://www.epa.gov/sites/default/files/2015-10/documents/rwqc2012.pdf
U.S. Environmental Protection Agency. 2019. Recommended human health recreational ambient water quality criteria or swimming advisories for microcystins and cylindrospermopsin. EPA 822-R-19-001. U.S. EPA Office of Water, Health and Ecological Criteria Division. https://www.epa.gov/sites/production/files/2019-05/documents/hh-rec-criteria-habs-document-2019.pdf
U.S. Environmental Protection Agency. 2022. National Lakes Assessment 2022 field operations manual. Version 1.2. EPA 841-B-21-011. U.S. Environmental Protection Agency, Office of Water, Washington, DC. https://www.epa.gov/system/files/documents/2022-07/FOM_NLA2022_%20Version1.2_220519_0.pdf
U.S. Environmental Protection Agency. 2024. National Lakes Assessment 2022: Technical support document. EPA 841-R-24-007. U.S. Environmental Protection Agency, Office of Water and Office of Research and Development. https://www.epa.gov/national-aquatic-resource-surveys/national-lakes-assessment-2022-technical-support-document
Acknowledgments and Disclaimer
The EPA Office of Water would like to thank the many people who contributed to this project. Without the collaborative efforts and support by state and Tribal environmental agencies, federal agencies and other organizations, this assessment of lakes would not have been possible. The EPA would like to thank the steering committee, state and Tribal environmental agencies, field crews, biologists, taxonomists, laboratory staff, data analysts, program administrators, EPA regional coordinators, statisticians, quality control staff, data management staff and many reviewers for their dedication and hard work. To the many hundreds of participants, the EPA expresses its gratitude.
NLA 2022 was led by Lareina Guenzel with significant data oversight, data analysis and programmatic help from: Karen Blocksom, Michael Dumelle, Phil Kaufmann, Amanda Nahlik, Tony Olsen, Steve Paulsen (retired), Dave Peck and Marc Weber from the EPA Office of Research and Development; Donny Benkendorf, Kevin Biallas, Kendra Forde, Danielle Grunzke, Brian Hasty, John Healey, Susan Holdsworth, Sarah Lehmann, Richard Mitchell and Garrett Stillings from the EPA Office of Water; EPA Regional Coordinators (Hilary Snook (R1), Emily Nering (R2), Frank Borsuk and Raffaela Marano (R3), Chris McArthur and Jerry Ackerman (R4), Mari Nord (R5), Rob Cook (R6), Gary Welker (retired) and Chris Janssen (R7), Liz Rogers (R8), Matthew Bolt (R9) and Lil Herger (retired) (R10)); and Alan Herlihy from Oregon State University. NLA 2022 report development was led by Lareina Guenzel with support from John Healey, Kerry Kuntz and Sarah Lehmann. Crow Insight (a subcontractor to Avanti Corporation) provided graphics support for the report and the interactive data dashboards, technical editing and layout assistance.
State and Interstate Partners
- Arkansas Energy and Environment
- California Department of Fish and Wildlife
- Connecticut Department of Energy and Environmental Protection
- Delaware Department of Natural Resources and Environmental Control
- Florida Department of Environmental Protection
- Florida Fish & Wildlife Conservation Commission
- Georgia Department of Natural Resources
- Idaho Department of Environmental Quality
- Illinois Environmental Protection Agency
- Indiana Department of Environmental Management
- Iowa Department of Natural Resources
- Kansas Department of Health and Environment
- Kentucky Energy and Environment Cabinet
- Louisiana Department of Environmental Quality
- Maine Department of Environmental Protection
- Maryland Department of Natural Resources
- Michigan Department of Environment, Great Lakes and Energy
- Minnesota Pollution Control Agency
- Mississippi Department of Environmental Quality
- Missouri Department of Conservation
- Nebraska Department of Environment and Energy
- Nevada Division of Environmental Protection
- New Hampshire Department of Environmental Services
- New Jersey Department of Environmental Protection
- New York Department of Environmental Conservation
- North Carolina Department of Environmental Quality
- North Dakota Department of Environmental Quality
- Oklahoma Water Resources Board
- Oregon Department of Environmental Quality
- Pennsylvania Department of Environmental Protection
- South Dakota Department of Agriculture and Natural Resources
- Susquehanna River Basin Commission
- Texas Commission on Environmental Quality
- Utah Department of Environmental Quality
- Vermont Department of Environmental Conservation
- Virginia Department of Environmental Quality
- Washington State Department of Ecology
- West Virginia Department of Environmental Protection
- Wisconsin Department of Natural Resources
- Wyoming Department of Environmental Quality
Tribal Partners
- Blackfeet Tribe
- Fond du Lac Band of Chippewa Indians
- Leech Lake Band of Ojibwa
- Oglala Sioux Tribe
- Rosebud Sioux Tribe
- Sisseton-Wahpeton Oyate of the Lake Traverse Reservation
- Spirit Lake Tribe
- Standing Rock Sioux Tribe
- Ute Indian Tribe of the Uintah and Ouray Reservation
Federal Partners
- U.S. Fish and Wildlife Service
- U.S. Forest Service
- U.S. EPA Office of Research and Development
- U.S. EPA Office of Water
- U.S. EPA Regions 1-10
Other Collaborators and Contractors
- Amnis Opes Institute
- Avanti Corporation
- BSA Environmental Services
- Crow Insight
- EcoAnalysts Inc.
- EnviroScience Inc.
- General Dynamics Information Technology
- Great Lakes Environmental Center Inc.
- Greenwater Labs
- Indiana University
- Midwest Biodiversity Institute
- Moss Landing Marine Labs
- Oregon State University
- Rhithron Associates Inc.
- Tetra Tech Inc.
- University of Houston Clear Lake
- University of Missouri
This report provides information on the quality of the nation’s lakes and reservoirs. It does not impose legally binding requirements on the EPA, states, Tribes, other regulatory authorities or the regulated community. This document does not confer legal rights or impose legal obligations upon any member of the public. This document does not constitute a regulation, nor does it change or substitute for any Clean Water Act provision or EPA regulation. The EPA could update this document as new information becomes available. The EPA and its employees do not endorse any products, services or enterprises. Mention of trade names or commercial products in this document does not constitute an endorsement or recommendation for use.