U.S. EPA National Lakes Assessment 2012
Percentage of Lakes in Most Disturbed Condition
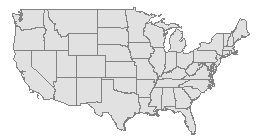
2012 Estimates and Change from 2007 | National


FETCHING
DATA
2012 % of Lakes (Most Disturbed)
2007-12
Change in % Points
U.S. Environmental Protection Agency (USEPA). 2016. National Lakes
Assessment 2012: A Collaborative Survey of Lakes in the United States.
Interactive NLA Dashboard. https://nationallakesassessment.epa.gov/
Assessment 2012: A Collaborative Survey of Lakes in the United States.
Interactive NLA Dashboard. https://nationallakesassessment.epa.gov/
* Reflects a statistically significant change at 95%
between 2007 and 2012. Such changes are also
indicated using darker colors.
between 2007 and 2012. Such changes are also
indicated using darker colors.
U.S. Environmental Protection Agency (USEPA). 2016. National Lakes
Assessment 2012: A Collaborative Survey of Lakes in the United States.
Interactive NLA Dashboard. https://nationallakesassessment.epa.gov/
Assessment 2012: A Collaborative Survey of Lakes in the United States.
Interactive NLA Dashboard. https://nationallakesassessment.epa.gov/

Relative Extent (% of Lakes in Most Disturbed Condition)
Relative Risk
Attributable Risk
Not tired of charts yet??
You and I, we'll get along well....
FETCHING
IMAGE
U.S. EPA National Lakes Assessment 2012
Percentage of Lakes in Each Condition Category
2012 Estimates and Change from 2007
Indicator | Aggregation

Condition Category
2012 Percentage of Lakes
2007-12
Change in % Points
U.S. Environmental Protection Agency (USEPA). 2016. National Lakes
Assessment 2012: A Collaborative Survey of Lakes in the United States.
Interactive NLA Dashboard. https://nationallakesassessment.epa.gov/
Assessment 2012: A Collaborative Survey of Lakes in the United States.
Interactive NLA Dashboard. https://nationallakesassessment.epa.gov/
* Reflects a statistically significant change at 95%
between 2007 and 2012. Such changes are also
indicated using darker colors.
between 2007 and 2012. Such changes are also
indicated using darker colors.